Actually, this Cook Political Report is even MORE problematical for Democrats…

than it looks:

In 2012 – according to exit polls – House Democrats won 60 percent of voters ages 18-29, 51 percent of voters ages 30-44, 47 percent of voters ages 45-64, and 44 percent of voters ages 65 and older. That combination was enough to win them a 49 percent to 48 percent plurality of all votes cast for House (even if Republicans still kept a comfortable majority thanks to Democrats’ inefficient distribution on the map and redistricting).

But had Democrats won the same levels of support among each age group in 2010, Republicans would still have won a clear plurality of all votes cast that year. How? Voters under the age of 30 were 19 percent of all voters in 2012, but just 12 percent of all voters in 2010. Likewise, voters 65 and up were 17 percent of all voters in 2012, but 21 percent of all voters in 2012. Herein lies the biggest danger for Democratic candidates in 2014.

And it looks pretty bad.  Basically, the Democrats have the usual “their demographic groups don’t turn out in midterms” problem; and there’s no indication that they’re doing anything effective in reversing that for 2014.  Or, more accurately, there’s no indication that Barack Obama is doing anything effective in reversing that for 2014, largely because he doesn’t really care.  “I won,” remember?  That’s the motto of this administration, first, last, and always.

Continue reading Actually, this Cook Political Report is even MORE problematical for Democrats…

Looking at Cook Report’s… looking at the 2012 race.

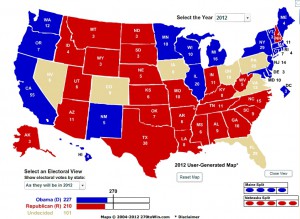
There’s been a bunch of predictive 2012 maps being thrown around today, so let’s look at one that is more an examination of trends at the moment.  The latest Cook Report survey has the current estimated Electoral Vote breakdown for 2012 as follows:

Solid Likely Lean Core Leaner
Romney 143 48 19 191 210
Obama 175 7 45 182 227

The visual:

In other words – and contrary to a lot of agitprop, on both sides – it’s game on, and we’re going to be fighting it out in the swing states again.  Cook has the toss-up states as being Colorado, Florida, Iowa, Nevada, Ohio, Pennsylvania, and Virginia: notice that all of these states are ones that Barack Obama won in 2008.  Also note that, of the seven states, only Colorado and Nevada has been really friendly territory for Democrats lately on a state level:

State Gov Sen House
CO D D R
FL R R R
IA R D R
NV R D D
OH R R R
PA R R R
VA R R* R

Virginia has a tied Senate, with the Republican Lt. Gov having the tie-breaking vote.  But that more or less doesn’t matter; what matters here is that when Obama campaigns in 2012 he will not be getting the same welcome in, say, Ohio, Pennsylvania, and Virginia that he did in 2008.  Of less, but still significant, interest is that Obama’s path to victory requires him to run the tables; we reapportioned EVs between 2008 and now, and largely at the Democrats expense.

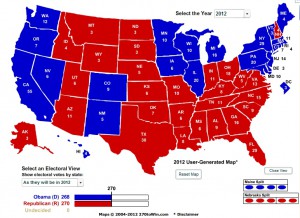
And here’s the practical application to all of the above: which is to say, the Republican path to victory from the Cook baseline.

Essentially: Florida, Ohio, Virginia, and have a nice day.

This can be done.

Moe Lane

Cook: State Republican parties gave national GOP 9 seats for 2012.

A much better gift than a tie or set of dishes, by the way.

Cook Political Report has more or less formalized their 2012 redistricting scorecard; their final score is a gain of one Republican seat, based solely on redistricting.  Cook notes that this total actually represents about 10 to 15 seats being fortified for the GOP, given that the majority of legislators who benefited from redistricting were Republicans.  This will no doubt infuriate Democrats, but then: elections matter.

In particular, state legislature elections matter. Continue reading Cook: State Republican parties gave national GOP 9 seats for 2012.

#rsrh Annnnnnnnnd here we start the 2012 House cycle.

Cook’s put up their first assessment of the 2012 election battlespace.  It’s reasonable, given the large number of Republican freshmen Congressmen this cycle:

Rating Dem GOP
Likely D 28
Lean D 11
Toss-Up 4 6
Lean R 14
Likely R 37
Total 43 57
At-Risk 15 20

Still, don’t get too attached to these numbers, though: this is all pre-redistricting.

#rsrh Latest Cook Shifts.

(All names in parentheses are of GOP challengers, of course.  Both because I have no interest in helping Democratic candidates and because Cook has been a not-quite-monotonous constant drumbeat of good news for the GOP lately.)

Consistent with things continuing to slide off of the beam for Democrats this year, in other words.

Rubber meeting the road: the 2010 Senate situation.

Charlie Cook is bearish on the thought of the GOP retaking the Senate this year – which, I should note, is a large step up from, say January 2009: back then they were talking about how the Democrats might increase their existing majority in 2010.  Charlie sets up the current situation as follows:

Three open seats currently in the hands of Democrats seem pretty likely to end up in the Republican column this year. Sen. Byron Dorgan’s seat in North Dakota is a goner. Democrats have strong candidates in Delaware (Chris Coons) and Indiana (Rep. Brad Ellsworth), but the strength of the opposition in the former and the toughness of the state in the latter means these Democrats, who might have won under other circumstances, are likely to come up short this time. Watch for both to resurface.

To score a net gain of 10 seats, Republicans would also have to sweep the seven Democratic seats that the Cook Political Report rates as Toss-Ups, taking open seats in Illinois and Pennsylvania and defeating incumbent Sens. Blanche Lincoln in Arkansas, Barbara Boxer in California, Michael Bennet in Colorado, Harry Reid in Nevada and Patty Murray in Washington. If the GOP came up short in one of those, they would have to make it up by carrying one of the two additional vulnerable Democratic races, claiming the open seat in Connecticut or beating Wisconsin incumbent Russell Feingold. Both of those races are competitive as well.

Here’s the basic problem.  Pick any one of those races listed above, and you can see how the Republican can win.  The trick is winning all of them, or at least ten of them* – statistically speaking, that’s a bit of a stretch.  Said stretch is modified by the fact that the results are not really dictated by random chance, but even so we’ll still have to count on everything breaking our way. Continue reading Rubber meeting the road: the 2010 Senate situation.

Meet fourteen worrying Democrats.

List extrapolated from here from Reid Wilson:

Candidate District PVI Cook Rating
Mike Ross AR-04 R+7 Likely Dem
Allan Boyd FL-02 R+6 Likely Dem
Alan Grayson FL-08 R+2 Toss-Up
Suzanne Kosmas FL-24 R+4 Lean Dem
Sanford Bishop GA-02 D+1 Safe Dem
Bill Foster IL-14 R+1 Lean Dem
Frank Kratovil MD-01 R+13 Toss-Up
Ike Skelton MO-04 R+14 Lean Dem
Earl Pomeroy ND-AL R+10 Lean Dem
Dina Titus NV-03 D+2 Toss-Up
Mike McMahon NY-13 R+4 Lean Dem
Michael Arcuri NY-24 R+2 Lean Dem
Chris Carney PA-10 R+8 Lean Dem
Ciro Rodriguez TX-23 R+4 Likely Dem

…and the reason that you can tell that they’re worrying is because everyone on that list commissioned a poll in the last three months of 2009. Reid explains why this is interesting:

Some political professionals advising their clients have told them to hold off conducting polls until this 3-month period, when the health care debate calms down. Dems saw a demonstrable drop in support during the final half of the year, thanks to health care, and polling during such a turbulent time gives unnecessarily worrying, or inaccurate, results.

Which last may or may not be true; but it still begs the question why these fourteen are worrying. Aside from the fact that they’re all in competitive districts.  And that all but one of them is in a race rated as competitive.  And that more than half of them are already at serious risk of losing their jobs.  And that it’s turning out to be a bad year to be an incumbent Democrat.  Other than that, no worries, yes?

Yes, ‘worry’ is an interesting word, ‘isn’t it?  It originally meant ‘to strangle,’ you know.

Moe Lane

Crossposted to RedState.

Old Narrative: DCCC cash advantage = No GOP gains.

New narrative:

The DCCC’s cash advantage is, at the moment, an important circuit breaker for 2010. For all the factors that point to big GOP House gains, it is the cash disparity could mean the difference between a bad year for Democrats and a really bad year.

At this rate, by June we’ll be hearing how the DCCC’s cash advantage will at least keep the GOP from having enough votes to override Obama’s vetoes next year.

Moe Lane

PS: Do I seem insufficiently anxious and resigned to failure? Well, it might be because I know a trend when I see it. Or maybe it’s because I’m currently on the right side of a 4-to-1 seat defense ratio. Or maybe it’s just that we watched the Democratic party pour quite a lot of money down a hole in Massachusetts.

PPS: More serious question: does the Citizens’ United case make monthly looks at fundraising totals more or less irrelevant? It just got a lot easier to fund promising candidates, on both sides.

PPPS: In a truly just world, there would be another announcement of a Democratic retirement this morning.

Crossposted to RedState.

Looking at the Cook Competitive Race Chart.

[UPDATE]: Welcome, Instapundit readers. And AoSHQ readers, too.

Looking at the Cook Political Report’s latest competitive race chart is in itself informative – the short version is that of the top 108 competitive races, the following ratios apply:

Dem GOP
Likely D 45 0
Leans D 23 1
Toss-up D 12 0
Toss-up R 0 3
Leans R 1 8
Likely R 0 15
Total 81 27

…but there’s some interesting things that can be seen with a little sorting.  Below is a chart of competitive seats, sorted by Cook Partisan Rating:

Continue reading Looking at the Cook Competitive Race Chart.