The May Rasmussen trust numbers.

There’s no article up on them yet, but the raw numbers are available here.

May 2010 April 2010
Issue Dem GOP Diff Dem GOP Diff Shift
Health Care 41% 48% (7) 41% 48% (7)
Education 40% 43% (3) 43% 39% 4 (7)
Social Security 40% 42% (2) 40% 42% (2)
Abortion 40% 42% (2) 40% 42% (2)
Economy 39% 48% (9) 39% 43% (4) (5)
Taxes 36% 51% (15) 36% 51% (15)
Iraq 36% 45% (9) 41% 44% (3) (6)
Nat’l Security 34% 51% (17) 40% 42% (2) (15)
Gov’t Ethics 33% 29% 4 34% 30% 4
Immigration 32% 47% (15) 38% 41% (3) (12)

Short version: 9 out of 10, and public trust in the Democrats to craft a proper immigration policy went through the floor. Continue reading The May Rasmussen trust numbers.

Rasmussen: Support for Obamacare repeal almost 2-to-1.

I almost wish I hadn’t written this: it would have been perfect for this Rasmussen poll on Obamacare.

Support for repeal of the new national health care plan has jumped to its highest level ever. A new Rasmussen Reports national telephone survey finds that 63% of U.S. voters now favor repeal of the plan passed by congressional Democrats and signed into law by President Obama in March.

Prior to today, weekly polling had shown support for repeal ranging from 54% to 58%.

Last year Sean Trende over at Real Clear Politics argued that the Democratic party took precisely the wrong lesson from 1994 by assuming that it was better to pass something titled ‘health care reform’ than to be visibly seen to fail; polls like this suggest that he’s right.

Roll on, November.

Moe Lane

Crossposted to RedState.

The April Rasmussen Trust numbers.

I’ve been trying to do this post for a few days (Rasmussen usually puts these numbers up before it does a formal article). Short version: eight out of ten for the GOP, but the Democrats made up lost territory across the board.

Apr-10 Mar-10
Issue Dem GOP Diff Dem GOP Diff Shift
Health Care 41% 48% (7) 37% 53% (16) 9
Education 43% 39% 4 40% 43% (3) 7
Social Security 40% 42% (2) 36% 48% (12) 10
Abortion 40% 42% (2) 32% 47% (15) 13
Economy 39% 43% (4) 37% 49% (12) 8
Taxes 36% 51% (15) 34% 52% (18) 3
Iraq 41% 44% (3) 39% 47% (8) 5
Nat’l Security 40% 42% (2) 36% 51% (15) 13
Gov’t Ethics 34% 30% 4 35% 33% 2 2
Immigration 38% 41% (3) 34% 47% (13) 10

Continue reading The April Rasmussen Trust numbers.

What Gallup *didn’t* do with their enthusiasm poll.

And they should have done this, too.

Gallup just published a poll on voter enthusiasm, broken down by age. The main point – younger voters are showing fairly typical enthusiasm levels towards the 2010 elections (i.e., low ones) – is interesting (and entertaining), but there’s another important bit that did not get particularly addressed. And it’s an even more entertaining point. Continue reading What Gallup *didn’t* do with their enthusiasm poll.

Rasmussen succumbs to snark.

Rasmussen usually makes a good-faith effort to avoid being sardonic, but sometimes they just can’t help themselves (bolding mine):

…voters are closely divided over Congress’ most important role: 49% say it’s passing good legislation, while 43% see it as preventing bad legislation from becoming law. That’s why 39% of voters say it’s a good thing in today’s political climate to be the Party of No. But 34% disagree and say it’s not a good thing.

Seventy-four percent (74%) of voters correctly identify Republicans as the political party some have labeled the Party of No. Despite, or perhaps because of, this high level of awareness, Republicans have built a solid lead over Democrats on the Generic Congressional Ballot.

The title of this Rasmussen Report, by the way: “57% Have More Trust In Those In Congress Who Voted Against Bailouts.”  And that’s not even the worst news for Democrats in there.  The worst news for Democrats in there is that they’ve spent the last year viciously attacking a movement that 52% of the population thinks has a better grasp of current affairs than the average Member of Congress.  Because that isn’t going to translate as ‘throw all of them out;’ it’s going to translate to ‘throw all of them who are standing in the way out”…

Moe Lane

Crossposted to RedState.

The March Rasmussen Trust Numbers.

Short version: nine out of ten, and the word ‘Pyrrhic’ seems ever-more appropriate when discussing the Democrats’ health care monstrosity.

Mar-10 Feb-10
Issue Dem GOP Diff Dem GOP Diff Shift
Health Care 37% 53% (16) 42% 45% (3) (13)
Education 40% 43% (3) 41% 38% 3 (6)
Social Security 36% 48% (12) 39% 42% (3) (9)
Abortion 32% 47% (15) 38% 42% (4) (11)
Economy 37% 49% (12) 41% 46% (5) (7)
Taxes 34% 52% (18) 37% 48% (11) (7)
Iraq 39% 47% (8) 38% 42% (4) (4)
Nat’l Security 36% 51% (15) 37% 47% (10) (5)
Gov’t Ethics 35% 33% 2 35% 28% 7 (5)
Immigration 34% 47% (13) 34% 39% (5) (8)

Continue reading The March Rasmussen Trust Numbers.

Unpacking the Rasmussen partisan numbers.

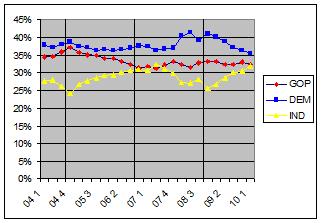
I had read the latest Rasmussen examination on the topic (short version: health care debate increased both the GOP and Democrats’ partisan identification) when I noticed that they had provided a handy table of their polling results over time.  I personally feel that this material is more accessible in graph form; so I pulled the results, averaged them by quarter, and graphed the whole thing out.  So:

The vertical bars represent the last three federal elections.  Using somewhat primitive analysis methods (‘squinting and looking’) 2005-2006 seems to show that Independent voters increased at the cost of Republican ones; and 2007-2008 seems to show Democratic voters increased at the cost of Independent ones.  And since then… Republican voters are more or less holding steady, while Democratic voters are dropping at about the same rate that Independent ones are growing. Continue reading Unpacking the Rasmussen partisan numbers.

Brent Budowsky and the poll-watcher’s delusion.

I don’t normally fisk, but let’s unpack this passage, shall we?  This article – called, amusingly enough, “Matt Drudge and the Republican delusion” – was dated March 25th, 2010 (today is March 30th, 2010):

Recently a Gallup poll, of course highlighted on Drudge, found that Obama’s numbers had (then) turned more unfavorable than favorable.

Presumably this one: 46/48 favorable/unfavorable.

This has (now) dramatically changed, unreported by Drudge, with Obama’s favorables now well above his unfavorables.

Presumably this one: 51% favorable.  March 25th, 2010.
But not this one: 47/50 favorable/unfavorable March 29th, 2010. That’s USA/Gallup: the current regular Gallup three-day has him at 48/46 favorable/unfavorable; check back again at 1 PM EST, but I don’t expect a massive jump.

The generic Democratic vote is leading the generic Republican vote in the last Gallup congressional election survey.

He means this survey: 47/44 Dem/Rep.  March 16th, 2010.
Not the latest one: 44/47 Dem/Rep. March 30, 2010 (no story yet).

The healthcare bill has passed and the president’s polls have moved up. Democratic numbers have crept up.

And, as you can see, they have crept right back down again.  Let’s add two more from Gallup, since we’re here: when they polled on reactions to the bill on the 23rd, the poll numbers were 49/40 in favor… and when they polled it again on the 29th, the numbers were 47/50. Continue reading Brent Budowsky and the poll-watcher’s delusion.

#rsrh Yeah, tomorrow’s the earliest that a #hcr bump…

will show up.  The stuff that comes out today is going to be polling before the Democrats finally passed the health care debacle; and the signing of said debacle won’t be until tomorrow.  Working on the assumption that this will translate into at least a temporary boost in popularity (safe guess), we should see a bump tomorrow, probably a bigger one on Wednesday, and… well.  Guessing how long the White House can milk a party-line vote on health care rationing is going to be a popular sport for Beltway types over the next few days.

As you might have guessed, I’m not expecting the bump to last for very long.

The February Rasmussen Trust Numbers.

I missed this when it came out last week, not that anybody was waiting for this with bated breath. Short version: eight for ten, and the Democrats made up a good bit of lost ground more or less across the board.

Feb-10 Jan-10
Issue Dem GOP Diff Dem GOP Diff Shift
Health Care 42% 45% (3) 37% 49% (12) 9
Education 41% 38% 3 36% 40% (4) 7
Social Security 39% 42% (3) 35% 45% (10) 7
Abortion 38% 42% (4) 32% 46% (14) 10
Economy 41% 46% (5) 42% 46% (4) (1)
Taxes 37% 48% (11) 34% 50% (16) 5
Iraq 38% 42% (4) 38% 46% (8) 4
Nat’l Security 37% 47% (10) 40% 49% (9) (1)
Gov’t Ethics 35% 28% 7 33% 30% 3 4
Immigration 34% 39% (5) 36% 43% (7) 2

Continue reading The February Rasmussen Trust Numbers.