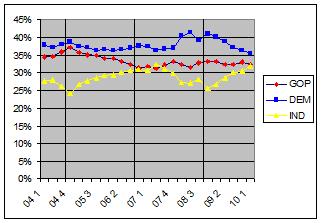
I had read the latest Rasmussen examination on the topic (short version: health care debate increased both the GOP and Democrats’ partisan identification) when I noticed that they had provided a handy table of their polling results over time. I personally feel that this material is more accessible in graph form; so I pulled the results, averaged them by quarter, and graphed the whole thing out. So:
The vertical bars represent the last three federal elections. Using somewhat primitive analysis methods (‘squinting and looking’) 2005-2006 seems to show that Independent voters increased at the cost of Republican ones; and 2007-2008 seems to show Democratic voters increased at the cost of Independent ones. And since then… Republican voters are more or less holding steady, while Democratic voters are dropping at about the same rate that Independent ones are growing.
All of this is important because the Democratic strategy for victory in 2010 is based on the conditions on the ground in the first quarter of 2009, which was a distinctly better time to be a Democrat than it is today. Rasmussen is not the only pollster to notice the Democrats’ loss of independent* voters (PPP‘s Tom Jensen is probably hoarse from all his shouting about that by now); but if the implications of this trend has been internalized by Democratic political strategists, it’s not obvious from their actions.
You can imagine how broken up I am about this.
Moe Lane
PS: If the Republican party would like to take long-term (or even medium-term) advantage of this, it would be well-advised to not forget about fiscal responsibility once we’re back in control of the House.
Very.
Well.
Advised.
*For the record: ‘independent’ does not mean ‘moderate’ in this context. It means ‘neither Republican nor Democrat.’
Crossposted to RedState.


One thought on “Unpacking the Rasmussen partisan numbers.”
Comments are closed.