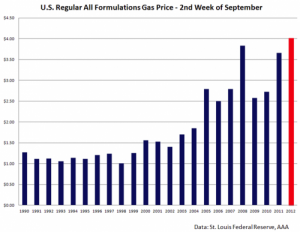
Via AoSHQ (and Zero Hedge) comes an alarming chart for your day:
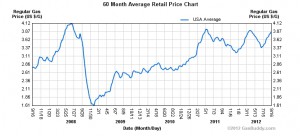
Now it’s important to look at what that graph is saying: it’s saying that gas prices have never been higher for the second week of September. This is kind of important because of the following graph, which shows overall gas prices over time for the last five years:
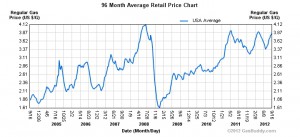
…or perhaps we should look at prices over the last eight years.
As you can see from the first graph, gas prices took a sudden tumble in the fall of 2008, as part of the general meltdown of the economy that was taking place then. As you can see from the second graph, prior to that point we were seeing steadily-increasing prices for gasoline; gas prices afterwards took about three years to recover. As of today, we’re more or less back to the peak prices of the summer of 2008.
There’s just one small problem: the economy hasn’t recovered. When it comes to gas prices, we are in the bizarre scenario where the economy is in stagnation, but the price of a vitally necessary commodity is showing severe inflation over time. If only there was, you know, a word or something to cover this sort of situation*…
Moe Lane
*Yes, I believe that I have used this particular formulation before. Which just shows that possibly the Democrats should start listening to me.


I don’t trust CPI.
I was chatting, over barbecue ribs, with one of my realtor friends .. specifically, one who has kept his license and is still a working relator, even in this market .. and he made an interesting point.
If you look at home prices vs. CPI, there’s a *very* clear split .. it starts at the point the BLS shifted from including home prices in CPI and replacing them with OER, Owners Equivalent rent. ORE, though, is estimated by the BLS respondents, it’s not based on anything better than their guesstimates… so self-deception applies.
This article (http://seekingalpha.com/instablog/2914431-bubbles-and-busts/768011-mismeasuring-housing-distorts-inflation-data) has a nice graph showing the real estate bubble, and how CPI *didn’t* account for it.
Why am I mentioning this in a post about gas prices? Well .. gas prices and CPI go hand in hand… and I’d love to see a graph showing the gas prices graphed next to Case-Schiller .. but I can’t find where someone else has drawn one.
Mew
It just amazes me the way this is always pitched on the news. They take pains to say the “core rate” of inflation is quite low. The core rate excludes gas and food..
So if you don’t eat or drive, everything’s great!
Gas prices are not part of the ‘inflation equation’. Problem solved.
Fundamentally, that word is altruism. It’s at the base of all of the debt, the pumping, the fleeing of companies…the ruination of our nation.
***
Peter Schiff would say, price this stuff (any stuff) in gold and get back to me.
Mew,
I plotted Case-Shiller (30 Jun 2012 S&P, June 2012–not seasonally adjusted) and Regular Gas (17 Sep 12, eia.gov, Weekly Retail Gasoline 1990-2012).
The correlation holds through the crash in 2008. Gas prices recover as seen above, but house prices remain stuck around $150,000 after the bubble peak of $225,000 in Jun 2006.
Gas prices are putting a damper on the economy and if the economy starts to improve gas prices will go up even more because demand will go up. Catch 22 at this point. We have to get gas prices lower to boost the economy and keep it lower to continue growing the economy for all.
@WildWlz, could I talk you either into showing your work (screen-cap posted to a photobucket account) or into sharing your sources (links?) .. please?
I would very much like to see all three together – gas, homes, and CPI.
Mew