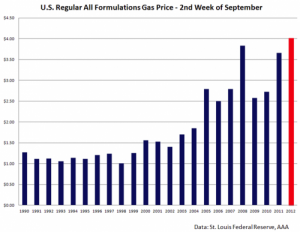
Via AoSHQ (and Zero Hedge) comes an alarming chart for your day:
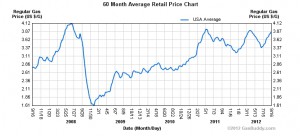
Now it’s important to look at what that graph is saying: it’s saying that gas prices have never been higher for the second week of September. This is kind of important because of the following graph, which shows overall gas prices over time for the last five years:
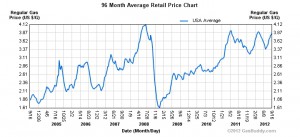
…or perhaps we should look at prices over the last eight years.
As you can see from the first graph, gas prices took a sudden tumble in the fall of 2008, as part of the general meltdown of the economy that was taking place then. As you can see from the second graph, prior to that point we were seeing steadily-increasing prices for gasoline; gas prices afterwards took about three years to recover. As of today, we’re more or less back to the peak prices of the summer of 2008.
There’s just one small problem: the economy hasn’t recovered. When it comes to gas prices, we are in the bizarre scenario where the economy is in stagnation, but the price of a vitally necessary commodity is showing severe inflation over time. If only there was, you know, a word or something to cover this sort of situation*…
Moe Lane
*Yes, I believe that I have used this particular formulation before. Which just shows that possibly the Democrats should start listening to me.


