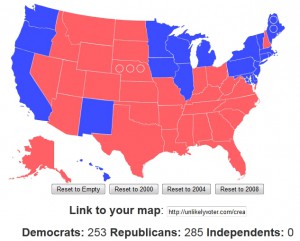
It’s an interactive Electoral College map that is not-Flash, for those who prefer that sort of thing: has the added advantage of also having 2000 data. In fact, just take a look at the 2000 map:
I could believe that that map could happen. Also: note that in 2000 the actual EV total was 271-266. Guess the Blue State model is encouraging a lot of people to vote with their feet.


If Romney wins the probable 4 states of NH, FL, NC and VA then Obama MUST carry all 3 of these toss up states: OH, PA and MI.
I think that Mitt’s 47% refers to the percent of the popular vote Obama will get and the EV margin will be between 50 ans 100.
I think this map demonstrates why Romney is still, despite all progress, behind. If Obama can carry PA, OH, and MI, you can’t really build a reasonable map where Romney wins.
I disagree. According to 270towin.com, if Romney carries NC, VA, FL, NH and one vote from ME, then he has 9 combinations of the remaining states for a win versus Obama having 4 winning combinations. There are also 3 ways to tie which would give the election to Romney via the House of Representatives where each state would get one vote.